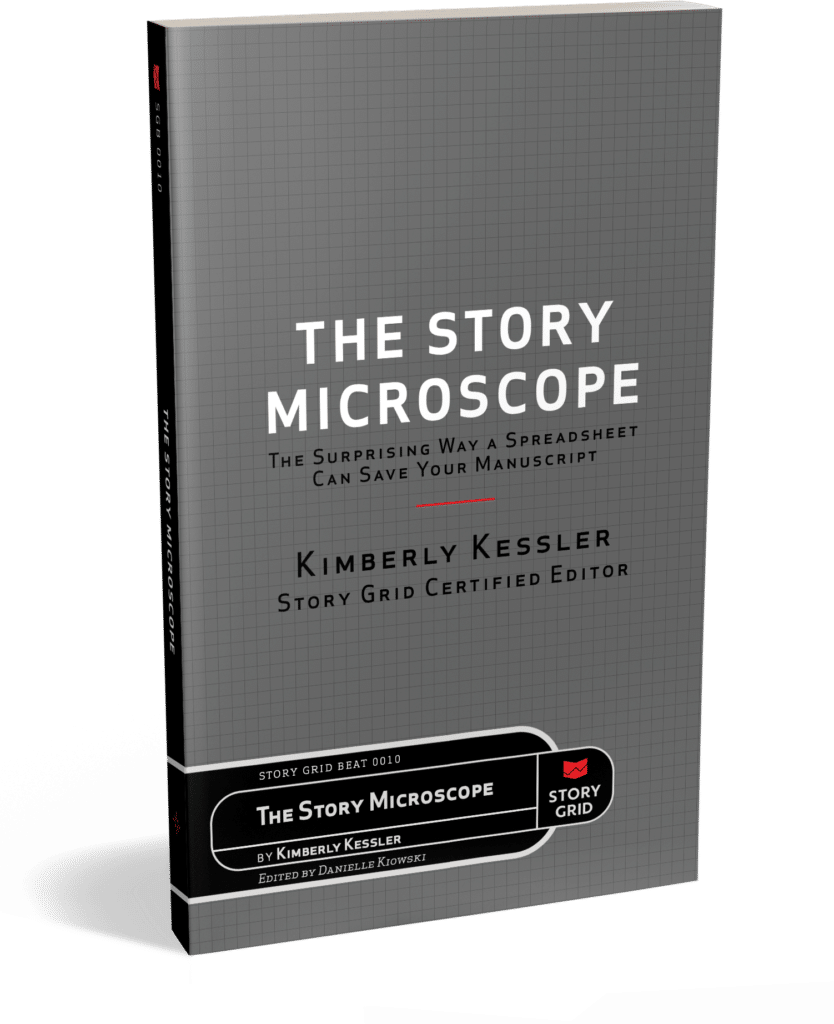
The Story Microscope: The Surprising Way a Spreadsheet Can Save Your Manuscript
Written by Kimberly KesslerEdited by Danielle Kiowski
You’re a writer with 1,001 questions about how to fix your manuscript and you want answers.
It’s hard to see your whole story in enough detail to find all the problems, much less craft the best solutions. After months of effort, you’re deep inside the characters and plot so you need a tool that’s objective—something to magnify and explain each scene and show you how they all connect.
The best way to answer the questions that are plaguing you is one you’ve probably never considered—a spreadsheet. In this beginner’s guide, Story Grid Certified Editor Kimberly Kessler shows you how to turn a spreadsheet into a precision editing tool. Using the Story Grid approach, the spreadsheet becomes a microscope through which you can see scenes, sequences, and your entire story in high resolution.
The Story Grid spreadsheet will save you time by quickly identifying the sources and locations of key problems. What you meant to say won’t cloud your ability to see what’s really on the page. With Kessler’s expert guidance, you’ll add the Story Grid spreadsheet to your writer’s toolkit, you’ll save your current manuscript, and improve all the stories that follow.
“You have nothing to fear,” says Kessler, “simply new connections to make.”

Purchasing Options
ALSO AVAILABLE
When you first take a look at the Story Grid Spreadsheet, it can be really overwhelming!
However, if you’ve decided to take a crack at Spreadsheeting a Masterwork or your own work-in-progress, buckle your seatbelt, because you are in store to learn a lot about storytelling.
When you first look at the Spreadsheet, you’ll see fourteen different data points that need to be tracked.
This is where the overwhelm starts!
So instead of tackling all fourteen at once, let’s break it down into four groups.
The 4Cs of Micro Analysis
1. Constraints – This narrows the scope of what we are tracking on a particular row of the Spreadsheet. In most cases, this will be a scene.
- Scene number
- Word count – How many words are in the scene?
- Story event – a summary of what happens in the scene.
2. Change – What is different at the beginning of the scene versus the end of the scene?
- Value shift – a description of the value that shifts in the scene.
- Polarity shift – Does the value shift from positive to negative or negative to positive?
- Turning point – At what point in our scene does the value shift?
3. Continuity – Who is telling the story? When and where does the scene take place?
- Point of view – From whose point of view is the scene presented?
- Period/Time – At what point in time does the scene take place?
- Duration – How much time passes during the scene?
- Location – Where does the scene take place?
4. Characters – Who populates the scene?
- On-stage characters – Which characters are present in the scene?
- Number of on-stage characters – How many of them are there?
- Off-stage characters – Which characters are mentioned in the scene (but are not present and active)?
- Number of off-stage characters – How many of them are there?
I’ve found that sections 1, 3, and 4 are easy to fill in. It’s mostly reading, counting, and entering data.
Section 2 is the meat of the analysis.
This is where you have to face whether or not you wrote a scene that works. If there’s no change in value, the scene doesn’t work. If you can’t identify the turning point, then the value shift is probably not strong enough.
This is what I love/hate about the Spreadsheet.
I’m in the middle of Spreadsheeting the second draft of my work-in-progress and I’m constantly forced to tell the truth about my scenes.
If you have never taken the time to Spreadsheet your own work-in-progress or a Masterwork that you love and admire, I highly recommend you give it a try.
You will be blown away but what you learn in the process!
Ok, so let’s say you do it. You spreadsheet your own manuscript or a Masterwork.
Now what?
What do you do with all this data you’ve collected?
Here’s an excerpt from The Story Microscope to explain:
CHAPTER 6: MAKING SENSE OF WHAT YOU FOUND
Even when you’ve finished filling in the spreadsheet, you may still have blanks, highlights, and notes to yourself all over. That’s perfectly fine and completely normal for a work in progress. In fact, masterworks may have blanks, too. This is how the spreadsheet helps you to identify areas where you could tell a better story.
There is one more important step to keep in mind for works in progress. Don’t fix! As tempting as it can be, it’s important to resist the urge to start fixing things while you’re working through the spreadsheet. The fixing step will come later after you’ve evaluated what you’ve found. When the time comes, it’s common to find solutions that solve multiple issues. For example, a macro-level change might make some micro fixes irrelevant. Do yourself a favor and complete the spreadsheet before you make changes to your story. There’s no need to create more work for yourself. Trust the process.
Now, it’s time to evaluate what you found and decide how you want to use those insights. As you look closely at what you’ve uncovered, you will start to see connections: the way each piece of information contributes to the scene and the way each scene contributes to the story. In a masterwork, this can inform and inspire your own choices in your writing. You can note what you liked that worked well or even what you didn’t like that you would do differently. In a work in progress, you can evaluate what exists and what is missing, what is working and what needs work. These insights become your to-do list for revisions.
Let’s take a closer look at how to interpret the spreadsheet, and then I’ll show you how to apply what you find to your own work.
LAYERS AND LENSES OF INSIGHT
A repeating pattern of threes can be found throughout the principles of Story.
The structure of beginning hook, middle build, and ending payoff.
The modes of narrative drive: suspense, mystery, and dramatic irony.
The types of conflict: internal, interpersonal, and extrapersonal.
We find a similar pattern when analyzing scenes. We can look at them at three different levels of analysis:
- Within one scene
- Between two or more scenes in a sequence or quadrant
- Within the whole of the story
ANALYZING A SINGLE SCENE
With this lens, we are looking at a single scene to see if it’s working. This means each cell is not only complete but contains the information that is the best fit for the scene.
You were very careful when filling in the spreadsheet to ensure that everything you entered was actually on the page. Now, when you go back and analyze your results, you can identify those places where the details you hoped to find were not on the page. This is what you’ll be tackling in revisions.
[…]
ANALYZING A SEQUENCE OF SCENES
When we analyze a sequence or quadrant, we look at how each individual scene functions in the context of the scenes around it as well as any patterns that appear within the group.
[…]
ANALYZING THE FULL LIST OF SCENES
For this level of analysis, we zoom all the way out and assess all the scenes together as well as the context of a single scene within the whole.
With this information for each scene, you can use other tools, like the Foolscap Global Story Grid and the Story Grid Infographic, for further analysis. These tools help you zoom out to look at each of your units of story from other angles.
APPLYING YOUR INSIGHTS
Now that you have completed the spreadsheet and analyzed it from all three vantage points, you are ready to culminate your findings.
Masterwork
If you have analyzed a masterwork, you have immersed at the ground level and observed what makes the story tick. Make a list of insights about each category. What choices did the author make? What impact do those choices have on the story? What experience do they create for the reader? What do you think the author’s choices say about their intention for the story? Do you like the choices or not? How would you apply these insights to your own story?
Work in Progress
If you’ve made a spreadsheet for your own work in progress, you have identified if anything is missing or not quite right for your story. Now, you can get ready to address the issues you’ve found by aggregating them into a list so you can determine the best solutions.
Based on your analysis of the spreadsheet, make a list of problems to solve. Consider identifying global-level problems first, followed by sequence/quadrant-problems, and then scene-level problems.
Then, consider what changes you could make to address the issues you’ve found. It may take time to discover the best solution, so don’t be in a rush. In fact, this is a great time to set your project aside and take in masterworks for the various aspects of your story that you are trying to improve. You will get a break from grinding on your own story and get inspired by the storytellers you love. When the time comes to revise, work from the largest to smallest unit of story, making global-level changes first and working down to the scene level.

As one-fifth of the Editor Roundtable Podcast, Kim has the divine privilege of nerding out every week studying story. She is obsessed with the internal genres and specializes in helping writers craft authentic character arcs in any setting. Her favorite stories use humor to explore and cope with grief and heartache. Her favorite clients are hungry to learn and bring their full authentic selves to the collaborative process. Nothing is more rewarding than digging in together to uncover the breakthroughs they need.

Danielle is a Story Grid Certified Editor from Las Vegas, Nevada. She is a writer, working on a fantasy spy thriller. She’s also a data scientist and a scuba diving instructor. She specializes in helping fantasy authors bring their worlds to life. She particularly enjoys intriguing stories, delving deep into crime, thriller, and mysterious performance works. As a data scientist, she knows her way around a spreadsheet. As a writer, she shares your passion for story and the written word. She’s looking forward to teaming up with you to help you tell your story.
